
WHAT IT TAKES TO WIN
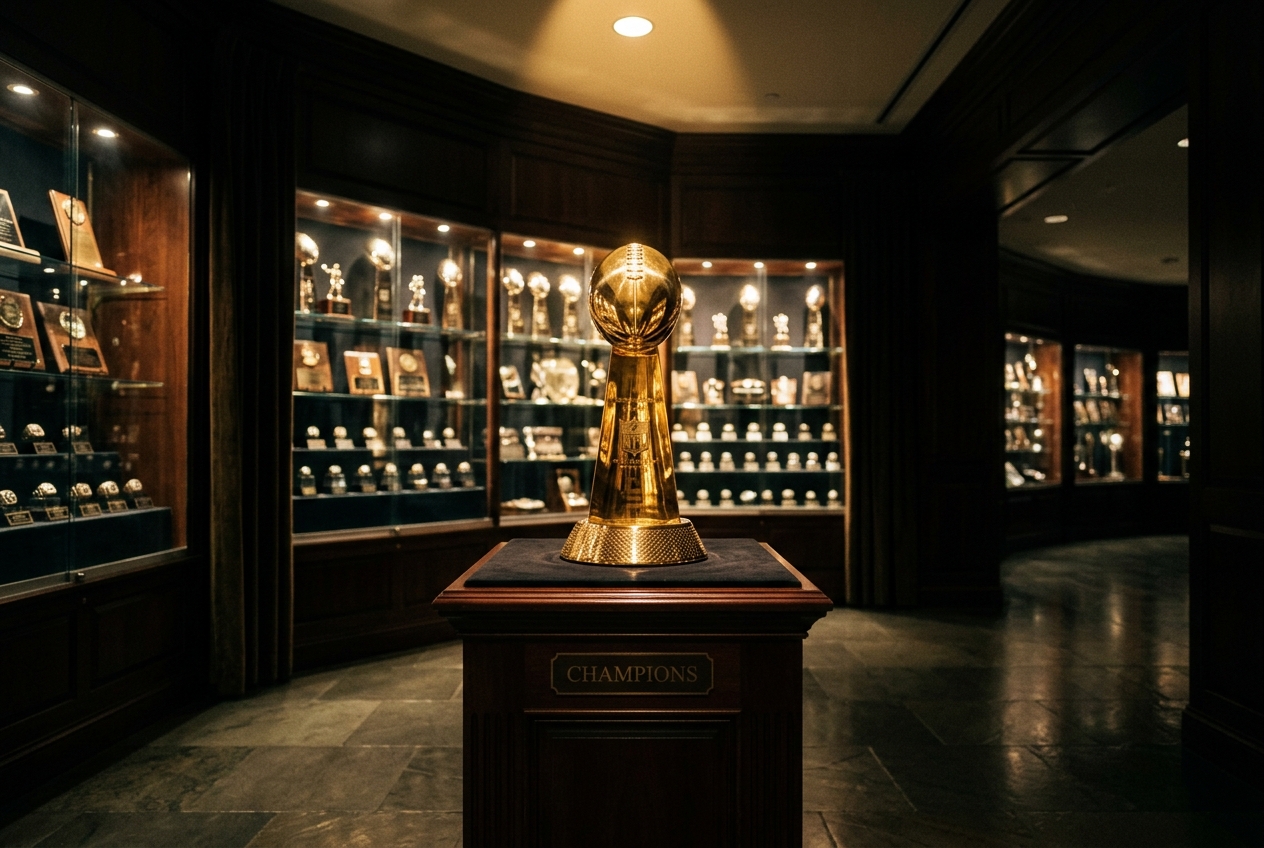
We analyzed 6,976 dynasty league championship rosters from the 2025 Sleeper season — 6,324 Superflex, 652 1QB — to identify what winning teams actually look like.
2025 Season Edition · Dynasty Trade Maker Research
IN THIS REPORT
KEY FINDINGS
60,635
Avg Roster Value
36.5%
Top-3 Concentration
of total roster value
27.4
Avg Roster Age
years
2.7
Top-30 WRs
per champion
The most striking finding: 82.5% of champions had a top-10 dynasty running back on their roster. Wide receiver depth matters too — champions averaged 2.7 WRs ranked in the top 30, suggesting a "multiple WR2s" approach outperforms concentrating on a single elite receiver.
HOW CHAMPIONS ALLOCATE ROSTER VALUE
Championship rosters allocated value heavily toward WR (35%) and RB (30.2%), with QB at 22.5% and TE at 12.3%.
SUPERFLEX vs 1QB
WHAT THIS MEANS FOR YOUR ROSTER
WR is the foundation, not RB. Despite the hype around elite running backs, champions spent more roster capital on wide receivers (35% vs 30.2%). WRs have longer careers and more stable values, making them the safest long-term investment.
The QB gap is format-specific. In 1QB leagues, champions spent just 21.4% on QB — meaning you can win with a mid-tier QB. In Superflex, QB jumps to 22.6%. If you are in SF and your QB room is weak, you are fighting an uphill battle.
TE premium is real but capped. At 12.3%, champions spent roughly 1/3 what they spent on RB. A top TE helps but overpaying for TE at the expense of RB/WR depth is a losing strategy. Get one good TE and focus elsewhere.
1QB champions lean harder into WR. With 36.5% vs SF's 34.9%, 1QB winners poured the savings from not paying for a second elite QB directly into their receiver room.
THE ELITE PLAYER QUESTION
Do you need elite players to win? The data says yes — but which position matters most depends on format.
SUPERFLEX (6,324 leagues)
1QB (652 leagues)
Champions concentrated 36.5% of their total roster value in their top 3 players — roughly a third of all value in three assets. The "stars and scrubs" approach has real support in the data.
STRATEGIC TAKEAWAYS
Consolidate, don't spread. Trading two solid pieces for one elite player is almost always the right move. Champions won with a handful of stars, not a deep roster of average players. If you can 2-for-1 up to an elite asset, do it.
RBs are the highest-floor path to a ring. 82.5% of champions had a top-10 RB — the single highest correlation. Even though RBs depreciate fast, having one during your contention window is essential.
The SF QB advantage is massive. 39.7% of SF champions had a top-5 QB. In 1QB, only 40.2% needed one — nearly the same! The difference is that in SF, having TWO good QBs is the real edge. 75.8% had a QB12 or better.
The TE market is inefficient. 44.3% of champions had a top-5 TE — and those top TEs are far cheaper than top RBs. If you can acquire a top-5 TE without sacrificing your RB/WR core, the data says it is worth it.
THE AGE OF A CHAMPION
27.4
Avg Roster Age
27.8
Avg Starter Age
5.4
Avg QBs/Roster
9.1 RB, 10.9 WR, 4.9 TE
36.5%
Top-3 Value Share
in 3 players
Championship rosters averaged 27.4 years old across all rostered players and 27.8 among starters. This is slightly older than expected — suggesting that the "youth at all costs" approach is not what actually wins titles. Championship teams balance youth with proven production.
AGE INSIGHTS
Starters are older than rosters. The 0.4-year gap between starter age (27.8) and roster age (27.4) tells you champions carry young depth but start experienced players. The bench is where you stash youth; the lineup is where you start winners.
Do not panic-sell aging stars. At 27.4 average, plenty of 28-30 year olds were on title rosters. If a player is producing, their age does not disqualify them from a championship. Sell when production drops, not when the birthday hits.
The sweet spot is 25-29. Champions leaned on prime-age players who are old enough to be proven but young enough to sustain production. Targeting players entering this window is the highest-EV move in dynasty.
Full rebuilds can still win. You do not need a 5-year-old average roster to compete. A rebuild that lands 2-3 elite young assets and supplements with mid-20s production can contend faster than a team hoarding rookies.
THE LEAGUE WINNERS: MOST COMMON CHAMPIONSHIP PLAYERS
METHODOLOGY
Dataset: 6,976 completed dynasty leagues from Sleeper, 2025 season. 6,324 Superflex, 652 1QB.
Collection method: Snowball sampling starting from Dynasty Trade Maker users' Sleeper leagues. For each league, we identified all owners and discovered their other leagues, repeating until reaching our sample target.
Champion identification: Sleeper's winners bracket API, identifying the roster with placement = 1 (league champion).
Player values: FantasyCalc consensus dynasty values at time of analysis, used for positional allocation and tier classifications.
Limitations: Sample is weighted toward active Sleeper dynasty managers (more engaged than average). Results reflect associations, not causation — having a top-5 QB correlates with winning, but doesn't guarantee it.
GET THE FULL REPORT AS A PDF
Download the complete championship analysis — printable, shareable, and formatted for easy reference.
HOW DOES YOUR ROSTER COMPARE?
Import your Sleeper league to see how your roster stacks up against 6,976 championship-winning teams.
DEEP DIVES
Each article below takes one question from this report and answers it in depth, with format-specific breakdowns and actionable takeaways.