
CHAMPIONSHIP RESEARCH
33 original data analyses from 6,976 dynasty league champions.
167,265 trades · 9,983 champion rosters · 7,155 drafts · 172,080 historical rosters
FLAGSHIP REPORTS
3
TRADING
5
Do Teams That Trade More Win?
167,265 real trades. Not how much — it's when.

What a Winning Trade Looks Like
Timing, direction, and the courage to overpay.

Who Wins Lopsided Trades?
The "loser" wins titles more often.

When to Make Your Move
Champions traded 68% more in playoff weeks.

The Average Trade Is 40% Lopsided
Full value-gap distribution.
CHAMPIONSHIP ROSTERS
8
Stars vs Depth
38.3% of value in 3 players.

Where Champions Put Their Value
WR 35.7%, RB 30.1%, QB 22.5%, TE 11.7%.

How Many Studs to Win?
Average: 1.07 elite players.

Championship DNA Players
Bijan 23%, Puka 19.3%.

Do You Need an Elite QB?
71.6% won without a top-3 QB.

Do Winners Pay Up at TE?
11.7% of value, but 67% had a top-10 TE.

The Real Age of a Champion
27.55 avg. Only 7.3% were young.
How Champions Build Rosters
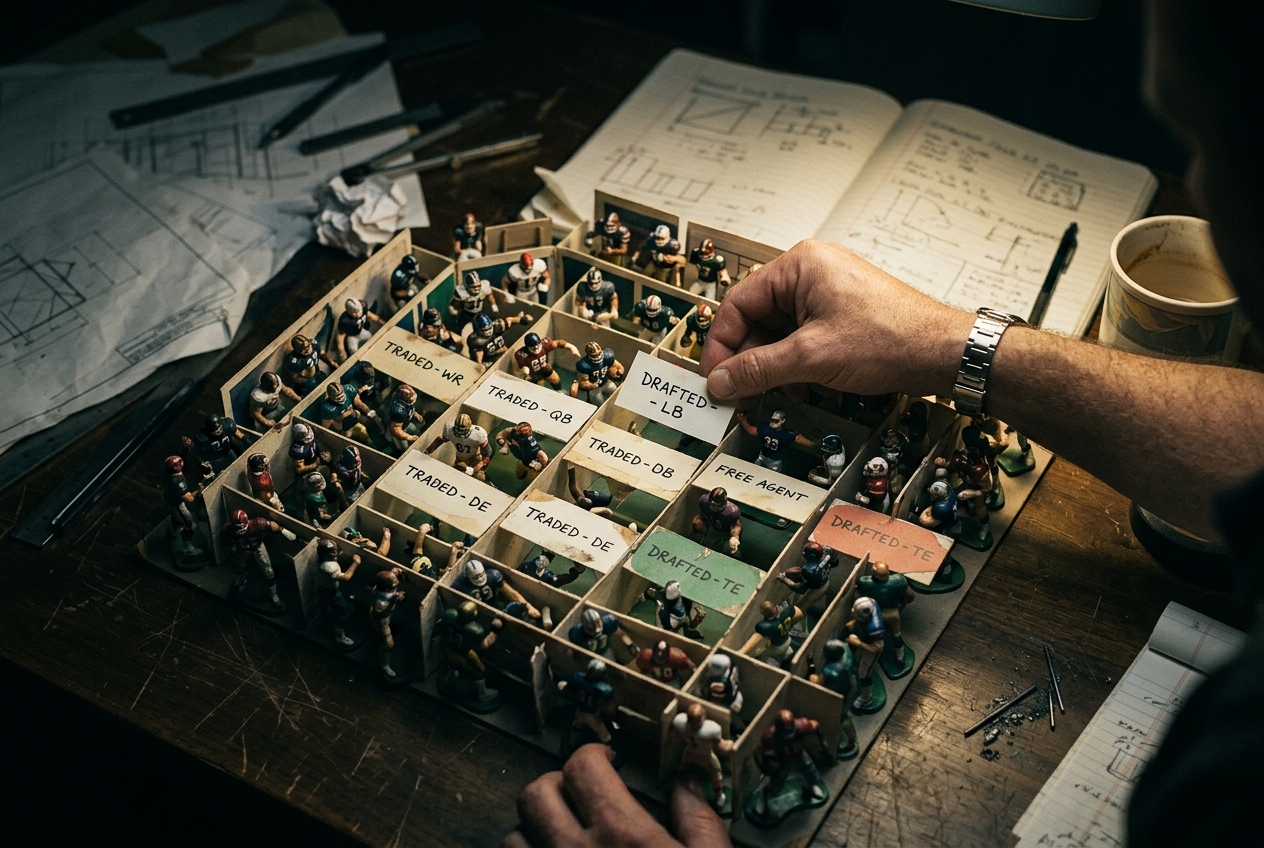
63% drafted or held. Trades: 21.5%.
DRAFTS
4

REBUILDS & CYCLES
3


AGING & VALUE
5




EARLIER CHAMPIONSHIP SPOKES
Do You Need a Top-5 QB?
Championship rates by QB tier, split SF vs 1QB.
The 2025 League Winners
Top 25 players by championship rate, indexed against rostership.
Stars and Scrubs vs Depth
Value concentration in top-3 players. 36.5% of total value.
The Age of a Champion
Avg roster age 27.4. Position-level breakdown.
Do Champions Pay Up at TE?
44.3% had a top-5 TE. The elite TE advantage by format.
Positional Blueprint
WR 35%, RB 30%, QB 23%, TE 12%. SF vs 1QB allocation table.